
UK Property Market Cycle Explained
The UK property market is rarely calm. It is one of the most emotionally charged, politically sensitive, and economically significant parts of British life. House prices, rents, buyer demand, and construction activity move in clear cyclical patterns rather than straight lines, driven by a powerful mix of economic conditions, government policy, credit availability, demographics, and crowd psychology.
These cycles typically run for 7 to 18 years from peak to peak. The best-known framework is the “18-year cycle” popularised by economist Fred Harrison, which draws on centuries of land value data going back to the 1700s. While every cycle has its own unique triggers and character, they all share the same fundamental rhythm: the interplay between limited supply and fluctuating demand, dramatically amplified by debt and speculation. Understanding where we are in the current cycle is not just academic; it is one of the most practical tools available for homeowners, investors, developers, and policymakers alike.
Table of Contents
The Nature of Property Market Cycles
At its core, a property cycle arises because housing supply responds slowly to demand changes (inelastic in the short term), while demand fluctuates rapidly with economic conditions, interest rates, and sentiment. Land scarcity in desirable locations adds another layer: buildings depreciate, but land values appreciate over time, driving much of the long-term upward trend in prices.
Economists often describe four main phases, though some models expand this to five, incorporating a mid-cycle correction:
Recovery (or Slump Bottom/Upturn): Prices stabilise or bottom out after a downturn. Confidence is low, transactions are subdued, and lending is tight. Early opportunistic buyers or investors enter. Construction is limited. This phase can last 4–6 years.
Expansion (Growth/Mid-Cycle): Steady price rises, improving economic conditions, easier credit, and rising transaction volumes. Demand strengthens as employment and wages grow. Supply begins to respond but often lags. This is typically a stable period for building positions.
Boom (Hyper-Supply or Peak): Rapid price acceleration, high speculation, increased construction, and loose lending. Sentiment becomes euphoric. Affordability stretches, and overbuilding can occur in some segments. This phase often features the strongest media attention and FOMO (fear of missing out).
Downturn/Recession (Correction/Crash): Overextension leads to a slowdown. Rising interest rates, economic shocks, or tighter credit trigger falling prices, reduced transactions, and potential negative equity. Forced sales can exacerbate declines. Recovery follows once fundamentals realign.
Variations include a “mid-cycle dip” around the halfway point, where a correction occurs without a full crash, as seen in recent data. Cycles are not perfectly predictable due to external shocks (e.g., pandemics, geopolitical events), but the rhythm persists because of structural factors like planning constraints and banking behaviour.
Historical Overview of UK Property Cycles
Post-war UK housing has seen multiple distinct cycles influenced by reconstruction, policy, inflation, and financial liberalisation.
1950s–1960s: Post-war boom in council housebuilding addressed shortages. The private market was steadier with economic growth. Prices rose modestly in real terms amid high construction output (peaking over 400,000 homes annually in the 1960s combined).
1970s: The “Barber Boom” (early 1970s) saw rapid growth fueled by credit expansion, followed by the 1973 oil crisis and sharp correction. Real prices fell significantly by the mid-1970s. High inflation masked some nominal declines.
Late 1980s Boom and Early 1990s Bust: Deregulation, falling interest rates, and the “Lawson Boom” drove strong growth. Prices peaked around 1989. High interest rates (to combat inflation and ERM exit) caused a painful bust. Nominal prices fell ~12%, with real losses deeper and negative equity widespread, especially in the South. Recovery was slow into the mid-1990s.
Mid-1990s to 2007: The longest and strongest upswing. Low inflation, stable growth, financial innovation, demutualisation of building societies, and rising homeownership drove prices higher. From the mid-1990s, prices more than doubled in many areas. The 2007 peak preceded the Global Financial Crisis (GFC). Prices fell ~18–20% nationally (more in some regions), with transactions collapsing.
Post-2008 Recovery and Beyond: Deep recession and regulatory tightening slowed recovery. Help to Buy and ultra-low rates from 2013 accelerated growth. Brexit uncertainty (2016 onward) introduced volatility. The COVID-19 pandemic caused a brief surge (stamp duty holiday, space demand) followed by rate hikes in 2022–2023, triggering a modest correction (around 4–5% dip in averages). By late 2025, many measures had recovered to or above prior peaks.
Long-term, UK house prices have risen dramatically: over 365% nominally since the early 1950s, with real gains even after inflation. However, volatility around the trend creates winners and losers depending on entry timing and leverage.
Key Drivers of the Property Cycle
Multiple interconnected factors drive cycles:
Interest Rates and Monetary Policy: The Bank of England’s base rate heavily influences mortgage costs. Low rates boost affordability and demand; hikes do the opposite. Rate changes affect prices more in supply-constrained areas. Recent 2022–2023 hikes demonstrated this, cooling the market without a deep crash.
Supply and Demand Fundamentals: Demand is driven by population growth, household formation, migration, employment, wages, and consumer confidence. Supply depends on housebuilding (historically lagging targets), planning permissions, and developer activity. Chronic undersupply in many regions amplifies price swings. Planning restrictions and NIMBYism contribute to inelastic supply.
Prices stabilise
Low confidence
Steady growth
Rising demand
Rapid price rises
High speculation
Falling prices
Tight credit
Credit and Lending Conditions: Availability of mortgages, loan-to-value (LTV) ratios, affordability checks, and investor lending (e.g., buy-to-let) are critical. Loose credit fuels booms; tightening (post-GFC rules) dampens them.
Economic and Employment Conditions: Recessions reduce demand; growth expands it. Regional economies matter tech/finance hubs versus manufacturing or public sector areas.
Government Policy and Taxation: Stamp duty changes, Help to Buy, Right to Buy, rent controls, capital gains tax, and building regulations all intervene. Infrastructure investment or regeneration (e.g., in northern cities) can shift local cycles.
Demographics and Social Factors: Ageing population, immigration, urbanisation, and preferences (e.g., post-COVID space needs) influence demand. Cultural emphasis on homeownership in the UK adds emotional and political weight.
Sentiment and Speculation: Psychology amplifies cycles of euphoria in booms, fear in busts.
External Shocks: Oil crises, financial crashes, pandemics, wars, or political events (e.g., Brexit) can accelerate or interrupt natural phases.
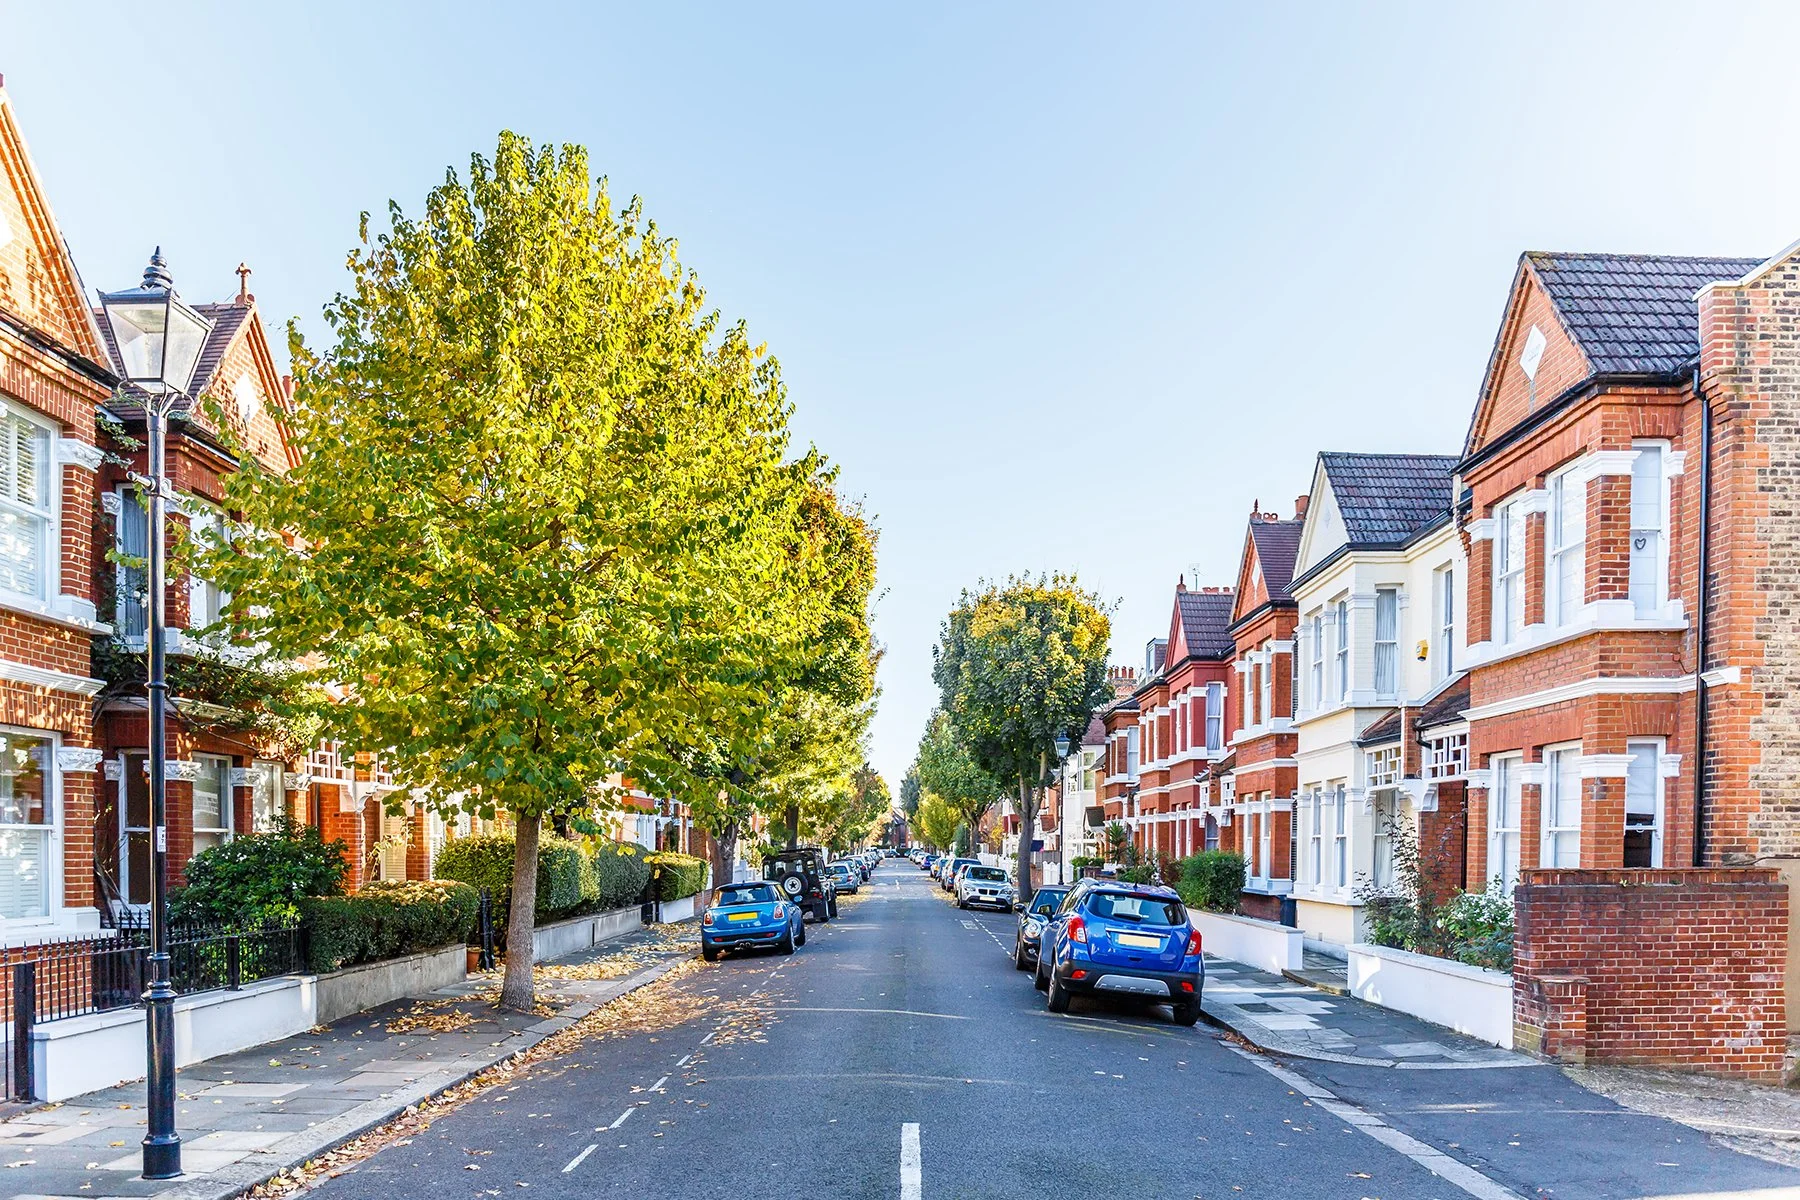
Regional Variations: The Importance of Location
National averages mask significant regional differences. London and the South East often lead booms due to international capital, jobs, and scarcity, but can correct sharply. Northern regions, including Yorkshire and the Humber, tend to be more affordable, lag in upswings, and sometimes show resilience or catch-up growth.
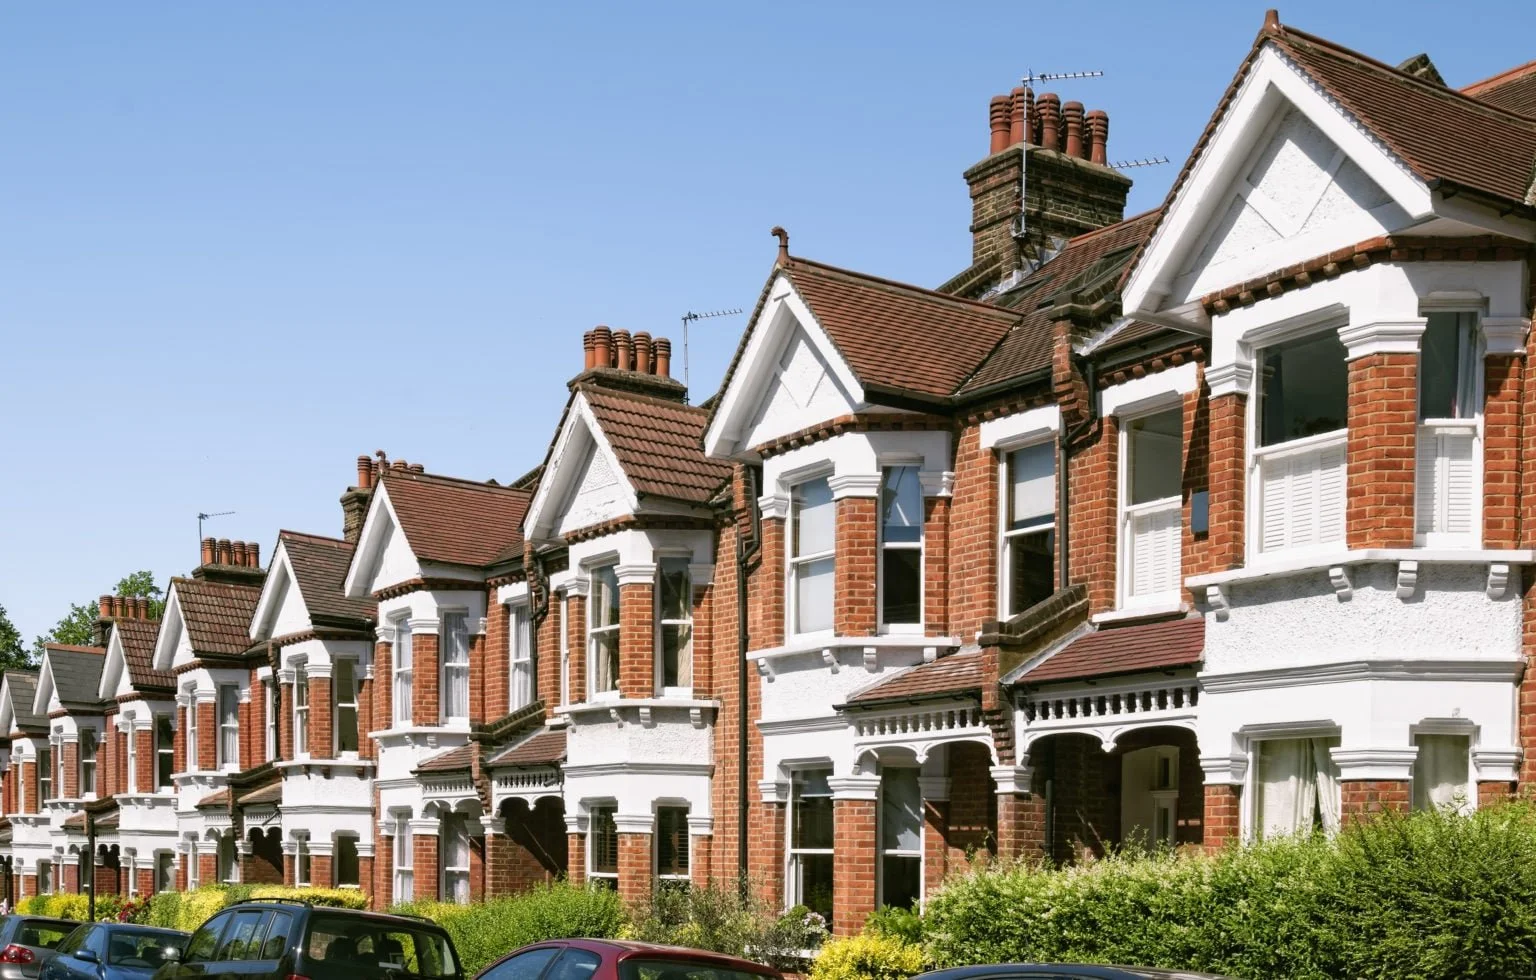
In West Yorkshire, areas like Leeds (financial and tech hub) and Bradford exhibit distinct dynamics. Leeds has seen stronger growth tied to economic diversification, regeneration (e.g., South Bank), and professional migration. Bradford, more affordable, benefits from regeneration momentum, cultural initiatives, and commuter links. As of early 2026 data, average prices were around £244,000 in Leeds and £187,000 in Bradford, with recent annual growth varying but showing northern resilience amid higher national affordability pressures.
Northern markets often benefit from lower entry prices, stronger rental yields, and policy focus on “levelling up.” However, they can be more sensitive to manufacturing or public sector employment shifts. Transport improvements (e.g., potential mass transit) and urban regeneration can create localized mini-cycles of uplift.
The Current Market Position (as of 2026)
Following the post-COVID surge and 2022–2024 correction driven by rate hikes, the market has stabilised and recovered. National averages have surpassed previous peaks in nominal terms, though real-term affordability remains stretched compared to income growth. Forecasts for 2026 suggest modest growth (1.5–4%), with northern and midlands areas potentially outperforming due to affordability and jobs.
Key indicators include cooling inflation, allowing potential rate cuts, steady employment in many sectors, persistent supply shortages, and ongoing demand from both owner-occupiers and renters. Challenges persist: high debt servicing costs for recent buyers, planning delays, and geopolitical uncertainties. In Yorkshire, regeneration projects and relative value support positive sentiment.
Many analysts place the market in a late-expansion or early boom phase within the longer cycle, post mid-cycle dip, though views differ on the timing of any future peak.
Risks, Opportunities, and Future Outlook
Risks: Over-leverage, policy missteps, economic slowdown, or new shocks could extend downturns. Affordability constraints may cap upside in expensive areas. Climate risks, energy efficiency requirements, and demographic shifts (e.g., smaller households) will reshape demand.
Opportunities: Undersupply suggests long-term structural support for values, especially in growth corridors. Diversification across property types (houses vs. flats), tenures, and regions mitigates risk. Quality, location, and adaptability matter more than ever.
Longer-term, prices are expected to rise with inflation plus a premium due to supply constraints, but volatility will continue. Northern regions may see relative catch-up if economic rebalancing succeeds. Predicting exact turning points is difficult; cycles are clearer in hindsight.
Conclusion
The UK property market cycle is a complex interplay of economics, policy, credit conditions, and human behaviour. Over time, it tends to move through repeating phases of recovery, growth, excess, slowdown, and correction, all set against a long-term upward trajectory driven by structural factors such as population growth, land scarcity, inflation, and broader economic expansion. While short-term movements can appear unpredictable, history shows that these cyclical patterns tend to re-emerge, helping to frame market shifts in a more structured and less emotional way. Understanding these phases does not eliminate uncertainty, but it does help contextualise current conditions rather than reacting purely to headlines or short-term price changes.
For Bradford, Leeds, and similar regional markets across the UK, local dynamics often shape how the national cycle is experienced on the ground. Factors such as regeneration projects, transport connectivity, employment growth, university demand, and relative affordability can either amplify or soften the impact of broader market trends. This means that even during periods of national slowdown, certain neighbourhoods may continue to perform steadily if underlying demand remains strong. Equally, during boom periods, not all areas rise at the same pace, highlighting the importance of micro-location analysis within the wider cycle.
While property cycles inevitably bring periods of uncertainty, they also reinforce the importance of long-term thinking. Investors, homeowners, and first-time buyers who focus on fundamentals such as location quality, tenant demand, build quality, and infrastructure development are generally better positioned to navigate fluctuations. Speculative behaviour, on the other hand, tends to be more vulnerable to abrupt shifts in sentiment and policy changes.
Ultimately, the UK property market has demonstrated resilience over many decades, adapting to changes in interest rates, government intervention, and global economic shocks. Awareness of its cyclical nature equips participants to make more measured, informed decisions rather than reactive ones, contributing to greater stability in outcomes over time. As of 2026, the cycle continues its familiar rhythm, shaped by evolving economic realities, affordability pressures, and policy choices that will influence both national trends and local performance in the years ahead.
Confused about the UK property market cycle and what it means? Talk to Armaani Estates now.
FAQs
Where are we in the UK property market cycle in 2026?
As of mid-2026, the UK market is in the late-expansion phase after recovering from the 2022-2024 correction. National prices have stabilised with modest growth, while northern areas like Leeds and Bradford are performing relatively well thanks to better affordability and steady demand.
When is the best time to buy a property in the cycle?
There is no perfect time. Buying during the recovery or early expansion phase often offers better value and stronger long-term growth. Focus on your personal affordability and needs rather than trying to perfectly time the market.
How does the property cycle affect rents in Bradford and Leeds?
Rental demand stays strong during slower sales periods, supporting steady or rising rents. In West Yorkshire, tight supply continues to favour landlords with good yields even when sales prices are flat. The rental market often provides more stability than sales across cycles.
Do Leeds and Bradford follow the same cycle as London?
No. London and the South usually lead with bigger booms and busts. Leeds and Bradford tend to lag but are more affordable and often show steadier growth and stronger rental performance. Northern markets can catch up during certain phases.
Should I wait for a crash before buying?
Waiting for a major crash is risky and often unrealistic due to chronic undersupply. Prices may stay high for years. It’s usually better to buy when it suits your circumstances rather than gamble on a deep downturn.
Is property still a good long-term investment?
Yes, over the long term, UK property has delivered strong capital growth despite cycles. Success depends on buying in the right location, holding patiently, and managing leverage wisely. Cycles create volatility, but the overall trend remains upward.